It's your turn!
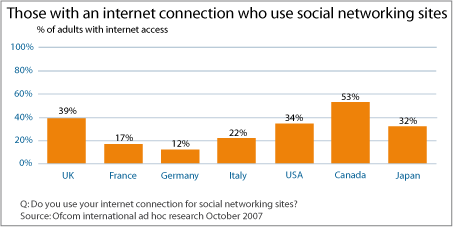
You are going to give a presentation about the use of internet and social networking sites. First set the scene by looking at the figures across the world.
Prepare how you would talk about this graph – include the name of the graph, some approximate numbers, and compare some numbers.

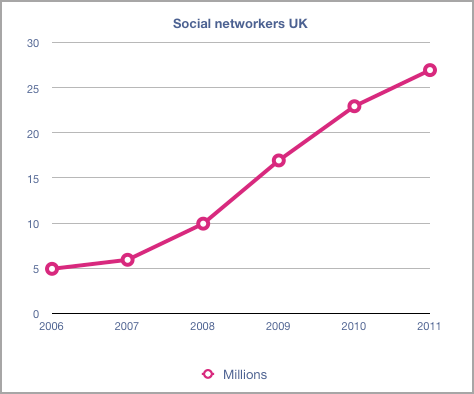
Now that you have the audience listening, use the next graph to focus only on the UK. This graph looks at the development of social network sites.
Describe some of the changes over the years using some expressions from ‘changes over time'.

I can describe a graph using a wide range of grammar and vocabulary.
I am able to use all forms of numbers with ease and with good pronunciation.
I know how to compare figures and evidence on graphs.
I can write clear, short, correct and consistent text on my slides.
