How to... simplify your charts
Example What is of interest to the audience?
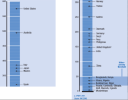
Alireza used a complex graph to talk about water use in the world. He is talking to a European and US audience so some of the information on this chart is not important and it is not easy to read.
Example
This is another way of showing the information which concentrates only on what is of interest to the audience.
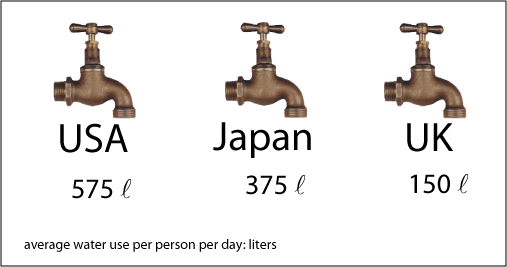
Example However you can go ONE step further:
The US and UK audience have identified with this slide as they now know how much water they personally use AND are now wondering about the big blank space on the right!!

Example
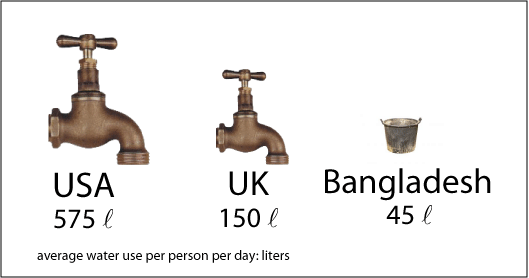
Now you show them the complete slide and without saying anything, you make your point that countries like Bangladesh have very little water.
")